

The case for change
CUH serves a diverse population with markedly different levels of need. While the quality of care is high, differences in access, experience and outcomes persist for some groups.
While many parts of Cambridgeshire are affluent, CUH also serves areas of significant deprivation, rural communities with transport challenges, a large Gypsy, Roma and Traveller population, and places with marked variation in life expectancy within short distances.
Differences in need do not arise from single factors in isolation. They reflect the combined and interacting effects of deprivation, age, disability, ethnicity, language, digital access, education and underlying health conditions. Age shapes need, access, experience and outcomes across our population. For CUH, this is especially important because a high proportion of our patients are older and may also be living with frailty, disability, multiple long-term conditions or social care needs. This means our approach to equity must be sensitive to the practical impact of age, while also recognising the distinct needs of children, young people and younger adults. For many patients, these factors reinforce one another, shaping whether and how they access care, and the outcomes they achieve.
These patterns are visible in our own services. For example, uptake of preventative interventions such as screening varies between communities, with lower coverage in some minoritised groups. A significant proportion of our patients have a disability, but access needs are not always met. Differences are also seen in waiting times within some areas, and in life expectancy. Taken together, it is clear that we are not yet always identifying or responding to unequal need.
This matters not only for equity, but for how we manage demand and deliver sustainable care. If some groups are less able to access prevention, early diagnosis or planned care, they are more likely to present later and with more complex needs. Addressing inequality is therefore the right thing to do for our patients, but also central to improving outcomes, reducing avoidable demand and making best use of our capacity.
CUH has both a statutory and moral responsibility to reduce inequalities in access, experience and outcomes. This responsibility is evolving. As expectations of the NHS shift towards prevention and population health, we need to build the capability to understand and act on the needs of the population we serve, not only those who present to our services. This includes strengthening how we use data to identify intersecting risks, working with partners to address barriers beyond the hospital, and designing services that are accessible, inclusive and responsive to different communities. Given our digital strengths as an organisation, there is more we can do with the data that we already have to better serve all our patients.
Providing genuinely equitable care requires a more deliberate and coordinated response. Our ambition is to embed equity into everyday delivery, while progressively extending our focus upstream. This means making inequalities visible, assessing decisions for their impact on different groups, and routinely designing care with patients and communities who face the greatest barriers. Over time, this will support a more proactive, population-focused approach to improving health and reducing demand across the system.
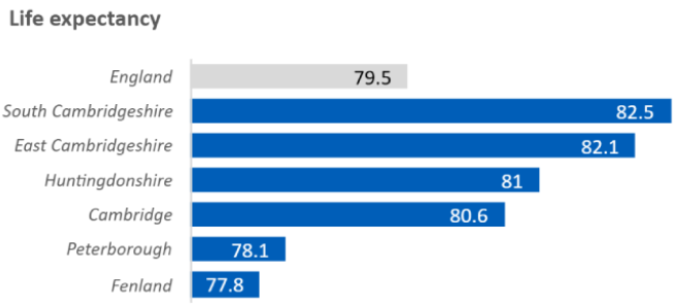
While Cambridge itself is relatively affluent, there are significant areas of poverty across the geography we serve, and variance in life expectancy. As a healthcare provider, we have a duty in ensuring the population we serve have equitable access to the services they need.
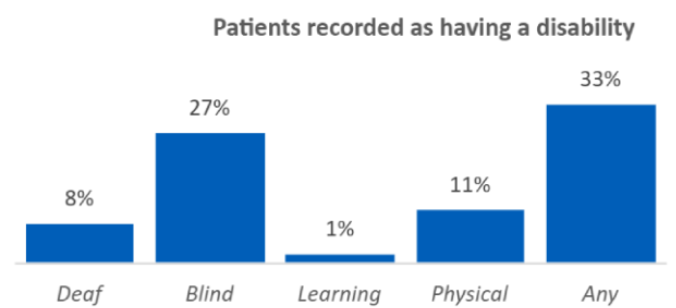
Our current approach does not consistently ensure that patients’ disabilities and individual needs are built into the design and operation of care models, creating a risk that services are not as accessible or responsive as they need to be.
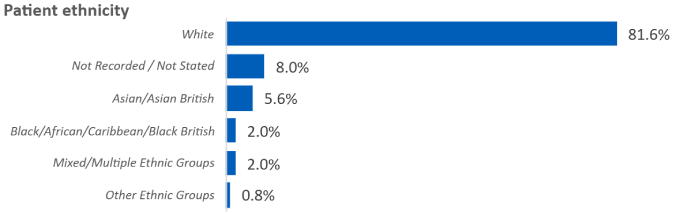
We do not currently generate sufficient insight from our data to understand how health outcomes vary between different communities, limiting our ability to target improvements where they are needed most.
Patient demographics data from CHEQS “Demographics” dashboard. Data for Q4 FY25/26 by Patients.
Non-urgent advice: Our areas of focus for our patients
- We can clearly see where care is not equitable.
-
- If we do not have complete information or do not listen to patient experience, inequity in careoutcomes can remain hidden and go unaddressed.
- A small number of clear, service‑level indicators would help teams spot problems sooner andact where care is not working equally.
- When data is easy to understand and combined with patient feedback, services can betteridentify where people are being left behind and target improvements more effectively.
- We are clear about actions to address health inequalities and disparities in access.
-
- When leaders routinely see and discuss a small set of equity indicators, problems are more likely to be addressed and followed through.
- Clear ownership and a structured approach give confidence that inequity is being managed consistently, not left to chance or individual effort.
- Fairness needs to be built into how decisions are made and reviewed, so changes do not unintentionally make care worse for some groups.
- Our services are easier to access and designed collaboratively with patients.
-
- When accessibility is built in from the start, fewer patients are left behind because their needs are anticipated rather than discovered too late.
- Designing services with patients and communities' leads to care that is more relevant and trusted, improving uptake, experience and outcomes for groups who are often underserved.
- Teams that feel safe to reflect and talk openly about inequality are better able to identify problems early and make practical improvements in day‑to‑day care.